Simple IOT application supported by real-time monitoring and data history
post, Aug 11, 2017, on Mitja Felicijan's blog
Initial thoughts
I have been developing these kind of application for the better part of my last
5 years and people keep asking me how to approach developing such application
and I will give a try explaining it here.
IOT applications are really no different than any other kind of applications.
We have data that needs to be collected and visualized in some form of tables or
charts. The main difference here is that most of the times these data is
collected by some kind of device foreign to developer that mainly operates in
web domain. But fear not, it's not that different than writing some JavaScript.
There are many devices able to transmit data via wireless or wired network by
default but for the sake of example we will be using commonly known Arduino with
wireless module already on the board → Arduino
MKR1000.
In order to make this little project as accessible to others as possible I will
try to make it as inexpensive as possible. And by this I mean that I will avoid
using hosted virtual servers and will be using my own laptop as a server. But
you must buy Arduino MKR1000 to follow steps below. But if you would want to
deploy this software I would suggest using
DigitalOcean → smallest VPS is only per month
making this one of the most affordable option out there. Please notice that this
software will not run on stock web hosting that only supports LAMP (Linux,
Apache, MySQL, and PHP).
But before we begin please take notice that this is strictly experimental code
and not well optimized and there are much better ways in handling some aspects
of the application but that requires much deeper knowledge of technology that is
not needed for an example like this.
Development steps
- Simple Python API that will receive and store incoming data.
- Prototype C++ code that will read "sensor data" and transmit it to API.
- Data visualization with charts → extends Python web application.
Step 1. and 3. will share the same web application. One route will be dedicated
to API and another to serving HTML with chart.
Schema below represents what we will try to achieve and how different parts
correlates to each other.
Simple Python API
I have always been a fan of simplicity so we will be using Bottle: Python Web
Framework. It is a single file web framework
that seriously simplifies working with routes, templating and has built-in web
server that satisfies our need in this case.
First we need to install bottle package. This can be done by downloading
bottle.py and placing it in the root of your application or by using pip
software pip install bottle --user.
If you are using Linux or MacOS then Python is already installed. If you will
try to test this on Windows please install Python for
Windows. There may be some problems
with path when you will try to launch python webapp.py so please take care
of this before you continue.
Basic web application
Most basic bottle application is quite simple. Paste code below in
webapp.py file and save.
# -*- coding: utf-8 -*-

import bottle

# initializing bottle app
app = bottle.Bottle()

# triggered when / is accessed from browser
# only accepts GET → no POST allowed
@app.route("/", method=["GET"])
def route_default():
  return "howdy from python"

# starting server on http://0.0.0.0:5000
if __name__ == "__main__":
  bottle.run(
    app = app,
    host = "0.0.0.0",
    port = 5000,
    debug = True,
    reloader = True,
    catchall = True,
  )
To run this simple application you should open command prompt or terminal on
your machine and go to the folder containing your file and type python webapp.py. If everything goes ok then open your web browser and point it to
http://0.0.0.0:5000.
If you would like change the port of your application (like port 80) and not use
root to run your app this will present a problem. The TCP/IP port numbers below
1024 are privileged ports → this is a security feature. So in order of
simplicity and security use a port number above 1024 like I have used port 5000.
If this fails at any time please fix it before you continue, because nothing
below will work otherwise.
We use 0.0.0.0 as default host so that this app is available over your local
network. If you find your local ip ifconfig and try accessing this site
with your phone (if on same network/router as your machine) this should work as
well (example of such ip http://192.168.1.15:5000). This is a must have
because Arduino will be accessing this application to send it's data.
Web application security
There is a lot to be said about security and is a topic of many books. Of course
all this can not be written here but to just establish some basic security → you
should always use SSL with your application. Some fantastic free certificates
are available by Let's Encrypt - Free SSL/TLS
Certificates. With SSL certificate installed you
should then make use of HTTP headers and send your "API key" via a header. If
your key is send via header then this key is encrypted by SSL and send encrypted
over the network. Never send your api keys by GET parameter like
http://example.com/?api_key=somekeyvalue. The problem that this kind of
sending presents is that this key is visible in logs and by network sniffers.
There is a fantastic article describing some aspects about security: 11 Web
Application Security Best
Practices. Please
check it out.
Simple API for writing data-points
We will now be using boilerplate code from example above and extend it to be
SQLite3 because it plays well with Python and can store quite large amount of
able to write data received by API to local storage. For example use I will use
data. I have been using it to collect gigabytes of data in a single database
without any corruption or problems → your experience may vary.
To avoid learning SQLite I will be using Dataset: databases for lazy
people. This package
abstracts SQL and simplifies writing and reading data from database. You should
install this package with pip software pip install dataset --user.
Because API will use POST method I will be testing if code works correctly by
using Restlet Client for Google
Chrome.
This software also allows you to set headers → for basic security with API_KEY.
To quickly generate passwords or API keys I usually use this nifty website
RandomKeygen.
Copy and paste code below over your previous code in file webapp.py.
# -*- coding: utf-8 -*-

import time
import bottle
import random
import dataset

# initializing bottle app
app = bottle.Bottle()

# connects to sqlite database
# check_same_thread=False allows using it in multi-threaded mode
app.config["dsn"] = dataset.connect("sqlite:///data.db?check_same_thread=False")

# api key that will be used in Arduino code
app.config["api_key"] = "JtF2aUE5SGHfVJBCG5SH"

# triggered when /api is accessed from browser
# only accepts POST → no GET allowed
@app.route("/api", method=["POST"])
def route_default():
  status = 400
  ts = int(time.time()) # current timestamp
  value = bottle.request.body.read() # data from device
  api_key = bottle.request.get_header("Api_Key") # api key from header

  # outputs to console received data for debug reason
  print ">>> {} :: {}".format(value, api_key)

  # if api_key is correct and value is present
  # then writes attribute to point table
  if api_key == app.config["api_key"] and value:
    app.config["dsn"]["point"].insert(dict(ts=ts, value=value))
    status = 200

  # we only need to return status
  return bottle.HTTPResponse(status=status, body="")

# starting server on http://0.0.0.0:5000
if __name__ == "__main__":
  bottle.run(
    app = app,
    host = "0.0.0.0",
    port = 5000,
    debug = True,
    reloader = True,
    catchall = True,
  )
To run this simply go to folder containing python file and run python webapp.py from terminal. If everything goes ok you should have simple API
available via POST method on /api route.
After testing the service with Restlet Client you should be able to view your
data in a database file data.db.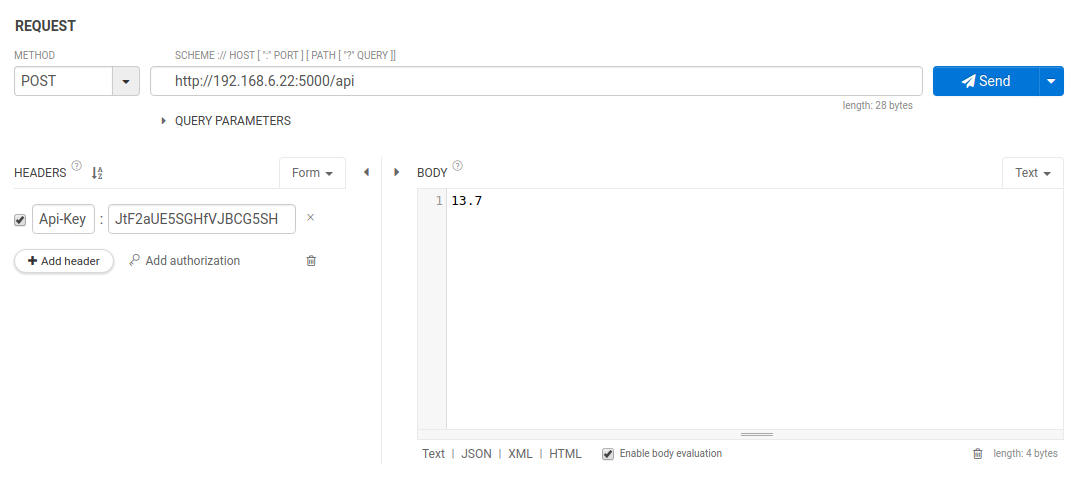
You can also check the contents of new database file by using desktop client
for SQLite → DB Browser for SQLite.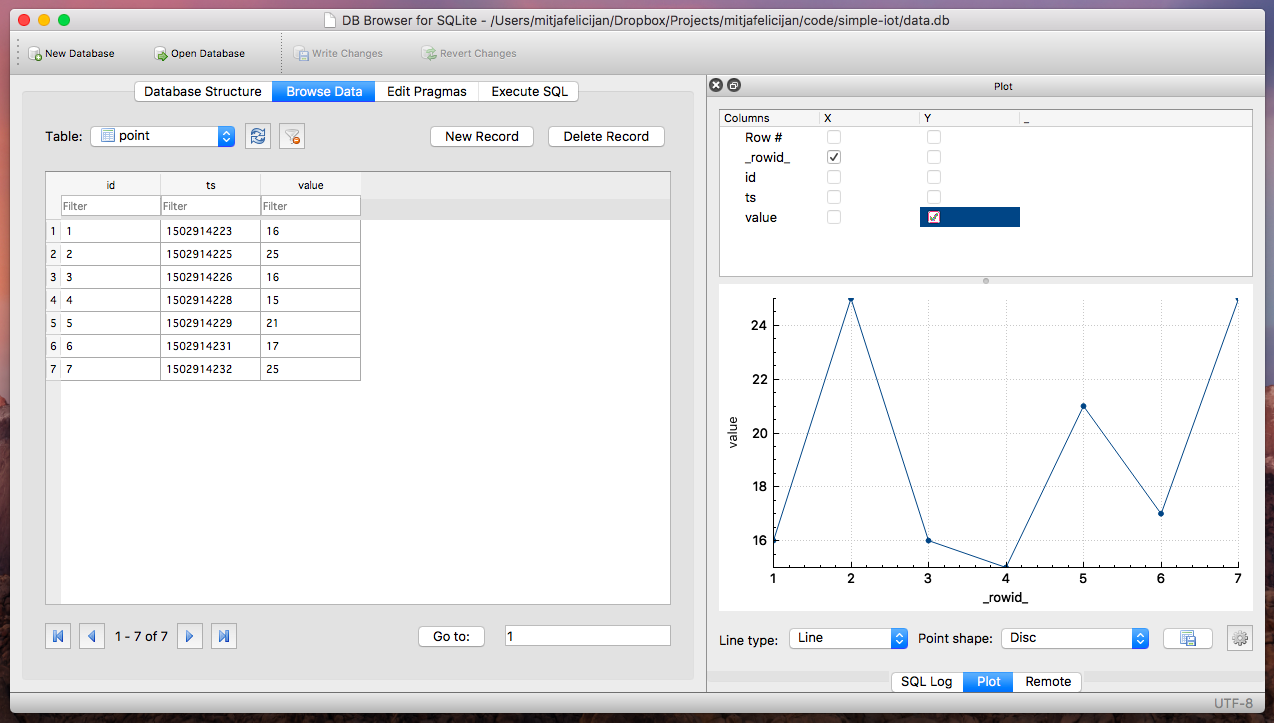
Table structure is as simple as it can be. We have ts (timestamp) and value
(value from Arduino). As you can see timestamp is generated on API side. If you
would happen to have atomic clock on Arduino it would be then better to generate
and send timestamp with the value. This would be particularity useful if we
would be collecting sensor data at a higher frequency and then sending this data
in bulk to API.
If you will deploy this app with uWSGI and multi-threaded, use DSN (Data Source
Name) url with ?check_same_thread=False.
Ok, now that we have some sort of a working API with some basic security so
unwanted people can not post data to your database can we proceed further and
try to program Arduino to send data to API.
Sending data to API with Arduino MKR1000
First of all you should have MKR1000 module and microUSB cable to proceed. If
you have ever done any work with Arduino you should know that you also need
Arduino IDE. On provided link you
should be able to download and install IDE. Once that task is completed and you
have successfully run blink example you should proceed to the next step.
In order to use wireless capabilities of MKR1000 you need to first install
WiFi101 library in Arduino IDE.
Please check before you install, you may already have it installed.
Code below is a working example that sends data to API. Before you try to test
your code make sure you have run Python web application. Then change settings
for wifi, api endpoint and api_key. If by some reason code bellow doesn't work
for you please leave a comment and I'll try to help.
Once you have opened IDE and copied this code try to compile and upload it.
Then open "Serial monitor" to see if any output is presented by Arduino.
#include <WiFi101.h>

// wifi settings
char ssid[] = "ssid-name";
char pass[] = "ssid-password";

// api server enpoint
char server[] = "192.168.6.22";
int port = 5000;

// api key that must be the same as the one in Python code
String api_key = "JtF2aUE5SGHfVJBCG5SH";

// frequency data is sent in ms - every 5 seconds
int timeout = 1000 * 5;

int status = WL_IDLE_STATUS;

void setup() {

  // initialize serial and wait for port to open:
  Serial.begin(9600);
  delay(1000);

  // check for the presence of the shield
  if (WiFi.status() == WL_NO_SHIELD) {
    Serial.println("WiFi shield not present");
    while (true);
  }

  // attempt to connect to wifi network
  while (status != WL_CONNECTED) {
    Serial.print("Attempting to connect to SSID: ");
    Serial.println(ssid);
    status = WiFi.begin(ssid, pass);
    // wait 10 seconds for connection
    delay(10000);
  }

  // output wifi status to serial monitor
  Serial.print("SSID: ");
  Serial.println(WiFi.SSID());

  IPAddress ip = WiFi.localIP();
  Serial.print("IP Address: ");
  Serial.println(ip);

  long rssi = WiFi.RSSI();
  Serial.print("signal strength (RSSI):");
  Serial.print(rssi);
  Serial.println(" dBm");
}

void loop() {
  WiFiClient client;

  if (client.connect(server, port)) {

    // I use random number generator for this example
    // but you can use analog or digital inputs from arduino
    String content = String(random(1000));

    client.println("POST /api HTTP/1.1");
    client.println("Connection: close");
    client.println("Api-Key: " + api_key);
    client.println("Content-Length: " + String(content.length()));
    client.println();
    client.println(content);

    delay(100);
    client.stop();
    Serial.println("Data sent successfully ...");

  } else {
    Serial.println("Problem sending data ...");
  }

  // waits for x seconds and continue looping
  delay(timeout);
}
As seen from example you can notice that Arduino is generating random integer
between [ 0 .. 1000 ]. You can easily replace this with a temperature sensor or
any other kind of sensor.
Now that we have API under the hood and Arduino is sending demo data we can now
focus on data visualization.
Data visualization
Before we continue we should examine our project folder structure. Currently we
only have two files in our project:
simple-iot-app/
We will now add HTML template that will contain CSS and JavaScript code inline
for the simplicity reason. And for the bottle framework to be able to scan root
application folder for templates we will add bottle.TEMPLATE_PATH.insert(0, "./") in webapp.py. By default bottle framework uses views/
subfolder to store templates. This is not the ideal situation and if you will
use bottle to develop web applications you should use native behavior and store
templates in it's predefined folder. But for the sake of example we will
over-ride this. Be careful to fully replace your code with new code that is
provided below. Avoid partially replacing code in file :) Also new code for
reading data-points is provided in Python example below.
First we add new route to our web application. It should be trigger when browser
hits root of application http://0.0.0.0:5000/. This route will do nothing
more than render frontend.html template. This is done by return bottle.template("frontend.html"). Check code below to further examine how
exactly this is done.
Now we will expand /api route and use different methods to write or read
data-points. For writing data-point we will use POST method and for reading
points we will use GET method. GET method will return JSON object with latest
readings and historical data.
There is a fantastic JavaScript library for plotting time-series charts called
MetricsGraphics.js that is based on
D3.js library for visualizing data.
Data schema required by MetricsGraphics.js → to achieve this we need to
transform data from database into this format:
[
  {
    "date": "2017-08-11 01:07:20",
    "value": 933
  },
  {
    "date": "2017-08-11 01:07:30",
    "value": 743
  }
]
Web application is now complete and we only need frontend.html that we
will develop now. If you would try to start web app now and go to root app this
will return error because we don't have frontend.html yet.
# -*- coding: utf-8 -*-

import time
import bottle
import json
import datetime
import random
import dataset

# initializing bottle app
app = bottle.Bottle()

# adds root directory as template folder
bottle.TEMPLATE_PATH.insert(0, "./")

# connects to sqlite database
# check_same_thread=False allows using it in multi-threaded mode
app.config["db"] = dataset.connect("sqlite:///data.db?check_same_thread=False")

# api key that will be used in Arduino code
app.config["api_key"] = "JtF2aUE5SGHfVJBCG5SH"

# triggered when / is accessed from browser
# only accepts GET → no POST allowed
@app.route("/", method=["GET"])
def route_default():
  return bottle.template("frontend.html")

# triggered when /api is accessed from browser
# accepts POST and GET
@app.route("/api", method=["GET", "POST"])
def route_default():

  # if method is POST then we write datapoint
  if bottle.request.method == "POST":
    status = 400
    ts = int(time.time()) # current timestamp
    value = bottle.request.body.read() # data from device
    api_key = bottle.request.get_header("Api-Key") # api key from header

    # outputs to console recieved data for debug reason
    print ">>> {} :: {}".format(value, api_key)

    # if api_key is correct and value is present
    # then writes attribute to point table
    if api_key == app.config["api_key"] and value:
      app.config["db"]["point"].insert(dict(ts=ts, value=value))
      status = 200

      # we only need to return status
      return bottle.HTTPResponse(status=status, body="")

  # if method is GET then we read datapoint
  else:
    response = []
    datapoints = app.config["db"]["point"].all()

    for point in datapoints:
      response.append({
        "date": datetime.datetime.fromtimestamp(int(point["ts"])).strftime("%Y-%m-%d %H:%M:%S"),
        "value": point["value"]
      })

    bottle.response.content_type = "application/json"
    return json.dumps(response)

# starting server on http://0.0.0.0:5000
if __name__ == "__main__":
  bottle.run(
    app = app,
    host = "0.0.0.0",
    port = 5000,
    debug = True,
    reloader = True,
    catchall = True,
  )
And now finally we can implement frontend.html. Create file with this name
and copy code below. When you are done you can start web application. Steps for
this part are listed below the code.
<!DOCTYPE html>
<html>

  <head>
    <meta charset="utf-8">
    <title>Simple IOT application</title>
  </head>

  <body>

    <h1>Simple IOT application</h1>

    <div class="chart-placeholder">
      <div id="chart"></div>
    </div>

    <!-- application main script -->
    <script src="https://cdnjs.cloudflare.com/ajax/libs/jquery/3.2.1/jquery.min.js"></script>
    <script src="https://cdnjs.cloudflare.com/ajax/libs/d3/4.10.0/d3.min.js"></script>
    <script src="https://cdnjs.cloudflare.com/ajax/libs/metrics-graphics/2.11.0/metricsgraphics.min.js"></script>
    <script>
      function fetch_and_render() {
        d3.json("/api", function(data) {
          data = MG.convert.date(data, "date", "%Y-%m-%d %H:%M:%S");
          MG.data_graphic({
            data: data,
            chart_type: "line",
            full_width: true,
            height: 270,
            target: document.getElementById("chart"),
            x_accessor: "date",
            y_accessor: "value"
          });
        });
      }
      window.onload = function() {
        // initial call for rendering
        fetch_and_render();

        // updates chart every 5 seconds
        setInterval(function() {
          fetch_and_render();
        }, 5000);
      }
    </script>

    <!-- application styles -->
    <style>
      body {
        font: 13px sans-serif;
        padding: 20px 50px;
      }
      .chart-placeholder {
        border: 2px solid #ccc;
        width: 100%;
        user-select: none;
      }
      /* chart styles */
      .mg-line1-color {
        stroke: red;
        stroke-width: 2;
      }
      .mg-main-area, .mg-main-line {
        fill: #fff;
      }
      .mg-x-axis line, .mg-y-axis line {
        stroke: #b3b2b2;
        stroke-width: 1px;
      }
    </style>

  </body>

</html>
Now the folder structure should look like:
simple-iot-app/
- webapp.py
- data.db
- frontend.html
Ok, lets now start application and start feeding it data.
python webapp.py- connect Arduino MKR1000 to power source
- open browser and go to
http://0.0.0.0:5000
If everything goes well you should be seeing new data-points rendered on chart
every 5 seconds.
If you navigate to http://0.0.0.0:5000 you should see rendered chart as
shown on picture below.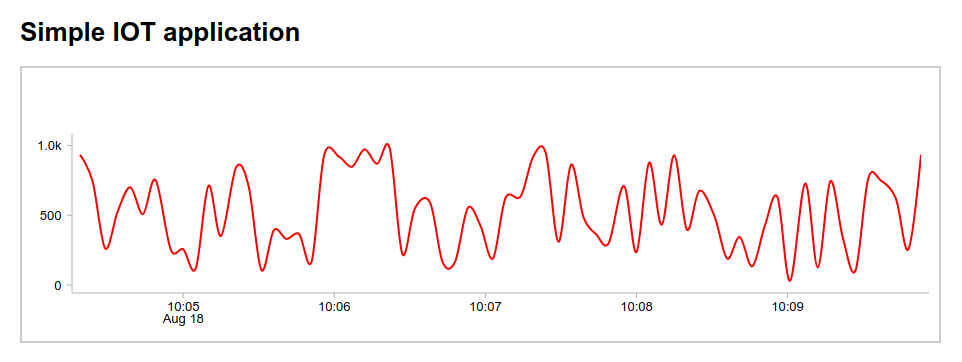
Complete application with all the code is available for
download.
Conclusion
I hope this clarifies some aspects of IOT application development. Of course
this is a minimal example and is far from what can be done in real life with
some further dive into other technologies.
If you would like to continue exploring IOT world here are some interesting
resources for you to examine:
Any comment or additional ideas are welcomed in comments below.