Profiling Python web applications with visual tools
post, Apr 21, 2017, on Mitja Felicijan's blog
I have been profiling my software with KCachegrind for a long time now and I was
missing this option when I am developing API's or other web services. I always
knew that this is possible but never really took the time and dive into it.
Before we begin there are some requirements. We will need to:
If you are using MacOS you should check out Profiling
Viewer or
MacCallGrind.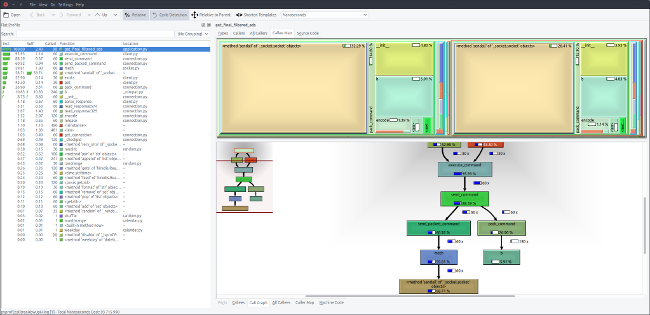
We will be dividing this post into two main categories:
- writing simple web-service,
- visualize profile of this web-service.
Simple web-service
Let's use virtualenv so we won't pollute our base system. If you don't have
virtualenv installed on your system you can install it with pip command.
# let's install virtualenv globally
$ sudo pip install virtualenv

# let's also install pyprof2calltree globally
$ sudo pip install pyprof2calltree

# now we create project
$ mkdir demo-project
$ cd demo-project/

# now let's create folder where we will store profiles
$ mkdir prof

# now we create empty virtualenv in venv/ folder
$ virtualenv --no-site-packages venv

# we now need to activate virtualenv
$ source venv/bin/activate

# you can check if virtualenv was correctly initialized by
# checking where your python interpreter is located
# if command bellow points to your created directory and not some
# system dir like /usr/bin/python then everything is fine
$ which python

# we can check now if all is good ➜ if ok couple of
# lines will be displayed
$ pip freeze
# appdirs==1.4.3
# packaging==16.8
# pyparsing==2.2.0
# six==1.10.0

# now we are ready to install bottlepy ➜ web micro-framework
$ pip install bottle

# you can deactivate virtualenv but you will then go
# under system domain ➜ for now don't deactivate
$ deactivate
We are now ready to write simple web service. Let's create file app.py and paste
code bellow in this newly created file.
# -*- coding: utf-8 -*-

import bottle
import random
import cProfile

app = bottle.Bottle()

# this function is a decorator and encapsulates function
# and performs profiling and then saves it to subfolder
# prof/function-name.prof
# in our example only awesome_random_number function will
# be profiled because it has do_cprofile defined
def do_cprofile(func):
  def profiled_func(*args, **kwargs):
    profile = cProfile.Profile()
    try:
      profile.enable()
      result = func(*args, **kwargs)
      profile.disable()
      return result
    finally:
      profile.dump_stats("prof/" + str(func.__name__) + ".prof")
  return profiled_func


# we use profiling over specific function with including
# @do_cprofile above function declaration
@app.route("/")
@do_cprofile
def awesome_random_number():
  awesome_random_number = random.randint(0, 100)
  return "awesome random number is " + str(awesome_random_number)

@app.route("/test")
def test():
  return "dummy test"

if __name__ == '__main__':
  bottle.run(
    app = app,
    host = "0.0.0.0",
    port = 4000
  )

# run with 'python app.py'
# open browser 'http://0.0.0.0:4000'
When browser hits awesome_random_number() function profile is created in prof/
subfolder.
Visualize profile
Now let's create callgrind format from this cProfile output.
$ cd prof/
$ pyprof2calltree -i awesome_random_number.prof
# this creates 'awesome_random_number.prof.log' file in the same folder
This file can be opened with visualizing tools listed above. In this case we
will be using Profilling Viewer under MacOS. You can open image in new tab. As
you can see from this example there is hierarchy of execution order of your
code.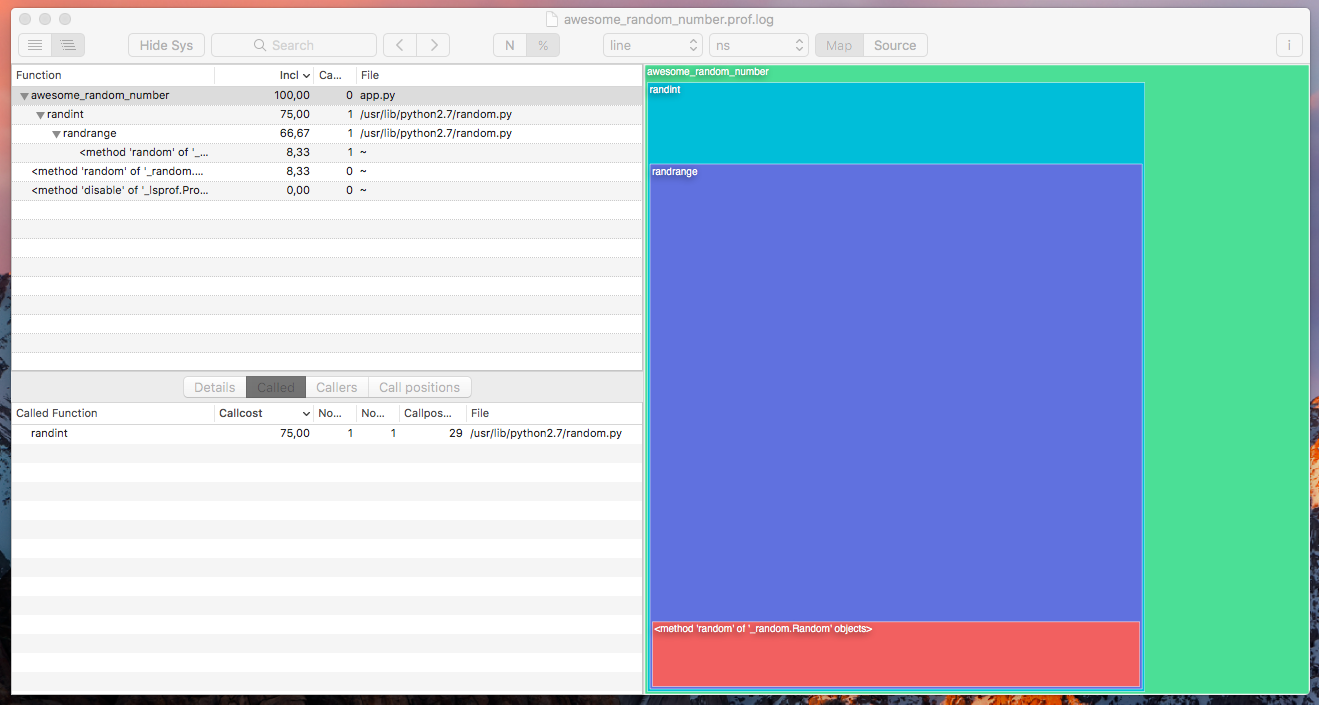
Make sure you convert output of the cProfile output every time you want to
refresh and take a look at your possible optimizations because cProfile updates
.prof file every time browser hits the function.
This is just a simple example but when you are developing real-life applications
this can be very illuminating, especially to see which parts of your code are
bottlenecks and need to be optimized.
Update 2017-04-22
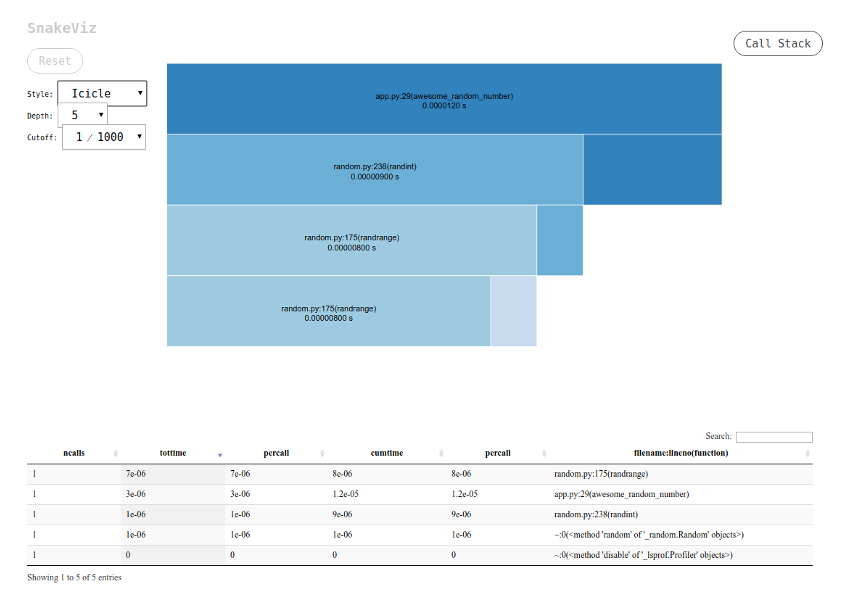
Reddit user mvt also recommended this awesome
web based profile visualizer SnakeViz
that directly takes output from
cProfile
module.
# let's install it globally as well
$ sudo pip install snakeviz

# now let's visualize
$ cd prof/
$ snakeviz awesome_random_number.prof
# this automatically opens browser window and
# shows visualized profile
Reddit user ccharles suggested a better
way for installing pip software by targeting user level instead of using sudo.
# now we need to add this path to our $PATH variable
# we do this my adding this line at the end of your
# ~/.bashrc file
PATH=$PATH:$HOME/.local/bin/

# in order to use this new configuration you can close
# and reopen terminal or reload .bashrc file
$ source ~/.bashrc

# now let's test if new directory is present in $PATH
$ echo $PATH

# now we can install on user level by adding --user
# without use of sudo
$ pip install snakeviz --user
Or as suggested by mvt you can
use pipsi.